
Principles of Biomedical Science 1: Classroom Activities
The Final Case Report was an activity the class completed in order to finalize all evidence and findings from the crime scene investigation project.
| Unit 1: Final Case Report |
The Experimental Design was an activity based off of Blood Spatter Analysts. The class designed their own experiments to experience having this job as well as test evidence from the crime scene.
| Activity 1.1.3 Experimental Design |
The Venn Diagram shows the differences and similarities between Type 1 and Type 2 Diabetes.
| Activity 2.1.1 Venn Diagram between Type 1 and Type 2 Diabetes |
This activity allowed the class to learn the importance of glucose tolerance tests and how it can affect the body. The graph gave the students a visual representation of three different patients all with different scenarios allowing them to learn how each individual human may work.
| Activity 2.1.1 Graph of Glucose Tolerance Testing vs. Insulin Testing |
The Feedback Loop Activity allowed the class to understand the importance of these in the body and how the body regulates a normal temperature.
| Activity 2.1.3 Feedback Loop- Body Temperature Regulation |
The Nutrition Report Activity allowed the class to learn and understand the importance and effect that macromolecules have on the body.
| Activity 2.2.2 Anna's Nutrition Report |
The Diabetes Brochure Activity allowed the class to create a summary of Diabetes and how it impacts everyday life.
| Activity 2.3.1 Diabetes Brochure |
The Diabetic Innovation Activity allowed the class to have an opportunity to create a product that would help a diabetic.
| Activity 2.3.4 Diabetic Innovation Powerpoint |
The Heart Diagram Activity allowed the class to visualize and understand the flow of blood through the heart.
| Activity 4.1.1 Heart Diagram |
The Blood Pressure Lab Report Activity summarized the blood pressure experiment. The class tested and manipulated blood pressures in many ways to create many results.
| Activity 4.2.2 Blood Pressure Lab Report |
My EKG shows the activity of testing the heart. The class ran their own EKG's and was able to visualize and understand what each part shows.
| Activity 4.2.3 My EKG |
The Cholesterol Brochure Activity allowed the class to understand the importance and the impacts cholesterol levels make on the body.
| Activity 4.3.1 Cholesterol Brochure |
The Infectious Agent Chart Activity allowed the class to learn about different bacterias, viruses, and etc.
| Activity 5.1.2 Infectious Agent Chart |
The Body System Activity allowed the class to research individual body systems and learn about their structures and functions.
| Activity 6.1.1 Body System Powerpoint (The Immune System) |
Human Body Systems: Classroom Activities
| Activity 1.3.1 Case Report- Studying the importance of bones |
| Activity 1.3.3 Biometrics PLAN- Creating a New Biometric Invention |
| Activity 2.2.5 Grand Rounds- Studying ALS |
| Acitivty 1.2.4 Bone Graph- Understanding measuring bones |
| Activity 2.3 Blood Glucose Regulation- Learning how the body regulates glucose |
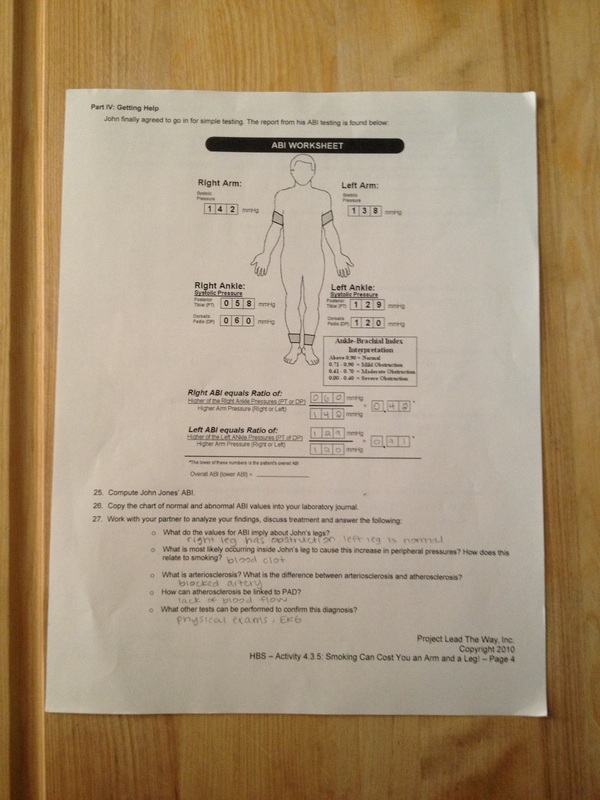
Activity 4.3.5: ABI Calculations- Studying the importance of ABI
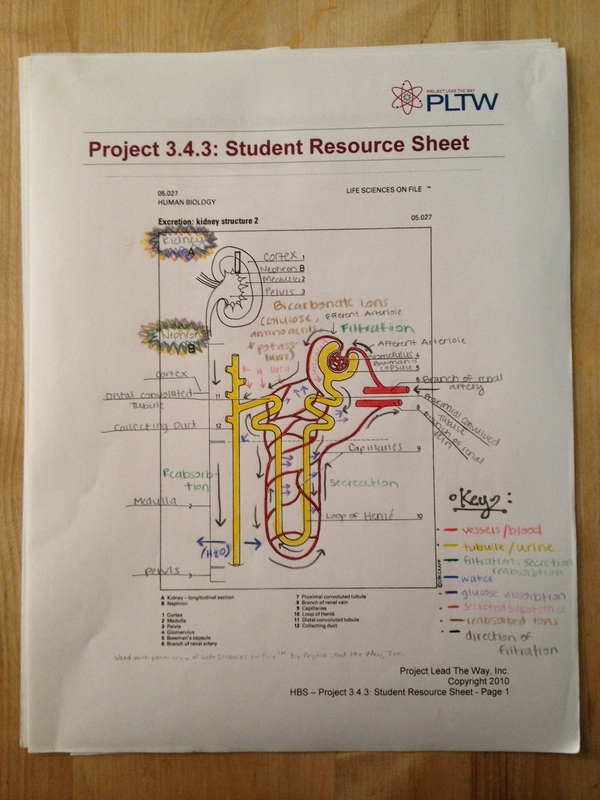
Activity 3.4.3 Nephron Diagram- Learning about Kidney Structure
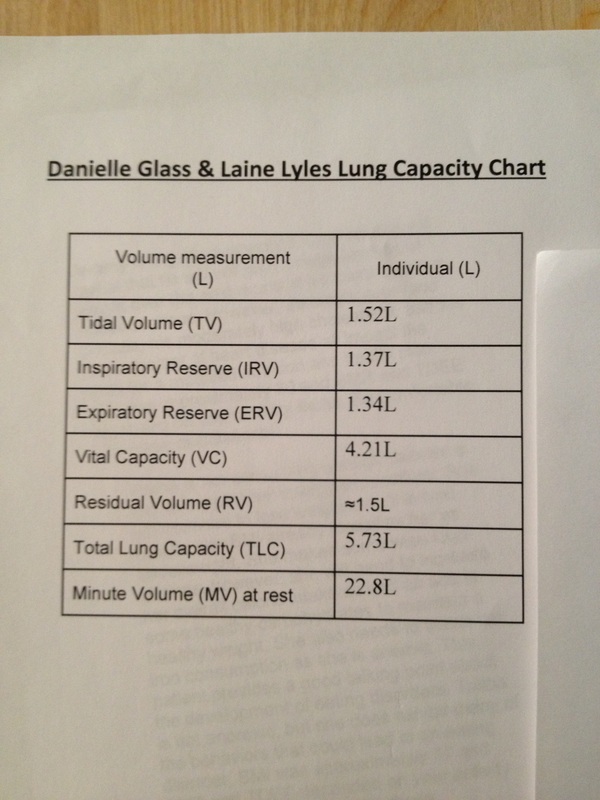
Activity 3.3.2: Lung Capacity Chart- Measuring Lung Capacity
Activity 3.4.3 Nephron Diagram- Learning about Kidney Structure
Activity 3.3.2: Lung Capacity Chart- Measuring Lung Capacity
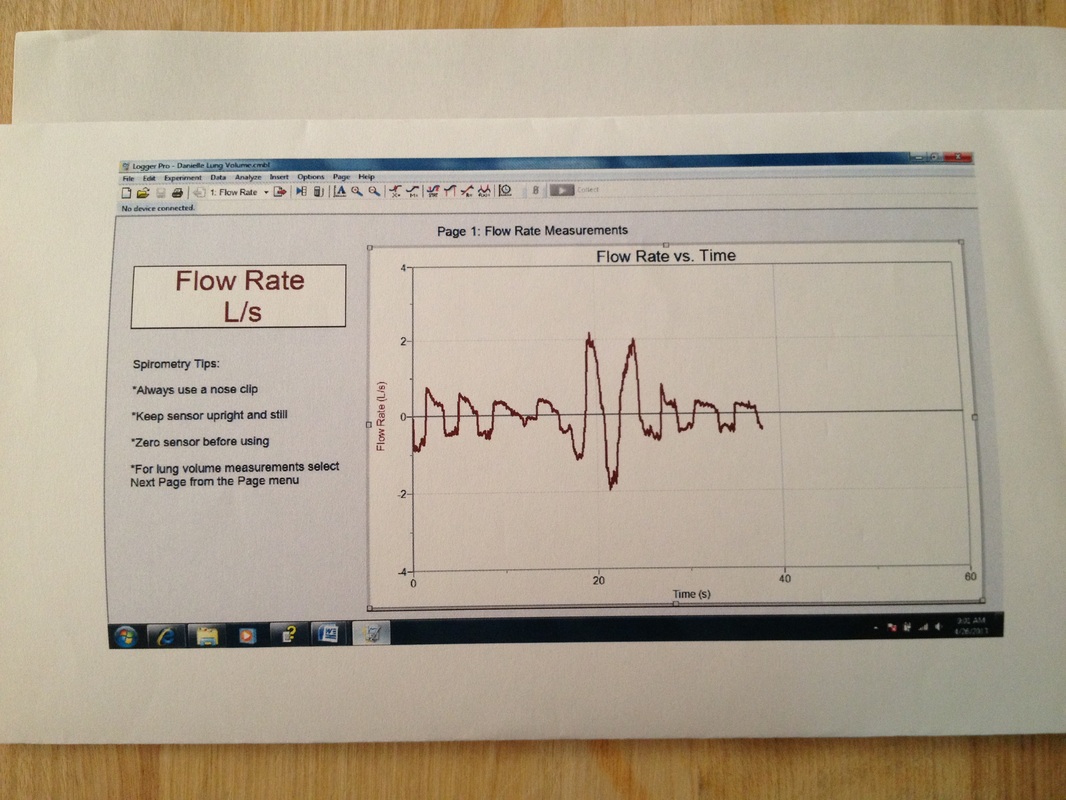
Activity 3.3.2: Lung Capacity Graph- Graphing Lung Capacity
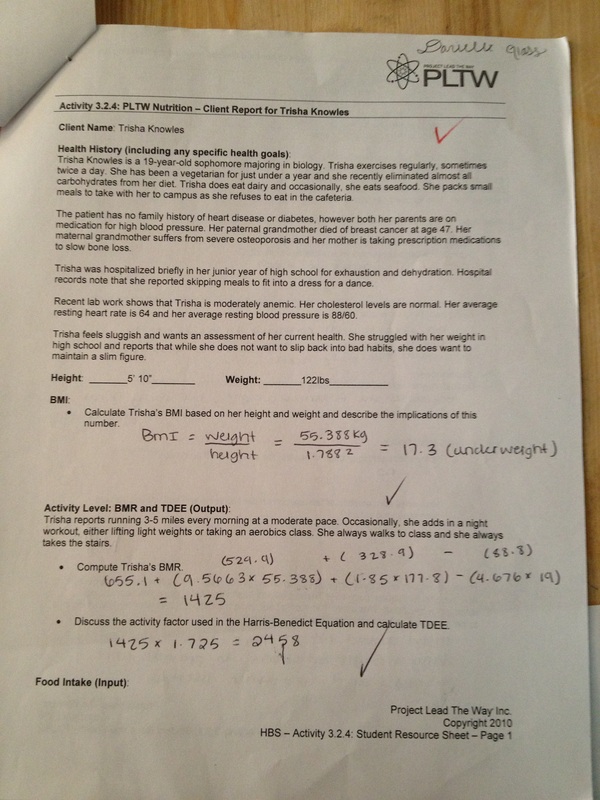
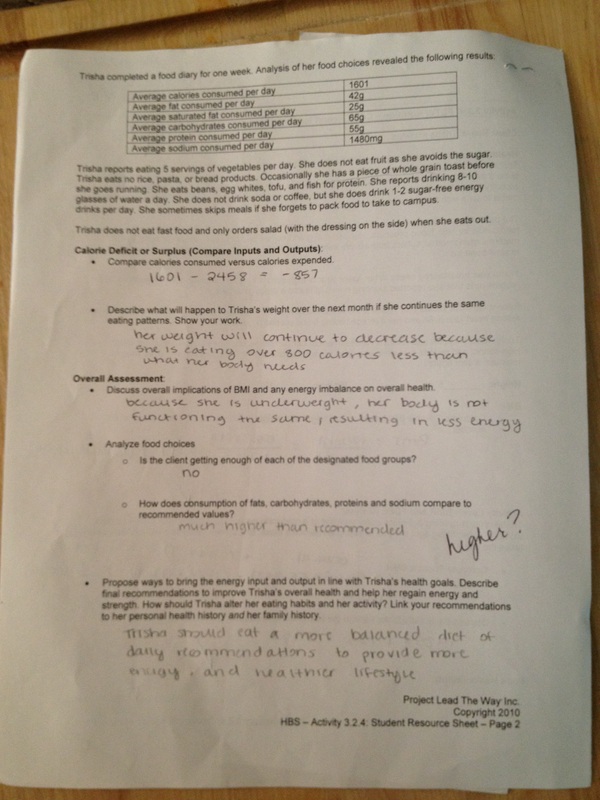
Activity 3.2.4: Nutritional Analysis- Studying Nutrition
Activity 3.2.4: Nutritional Analysis- Studying Nutrition
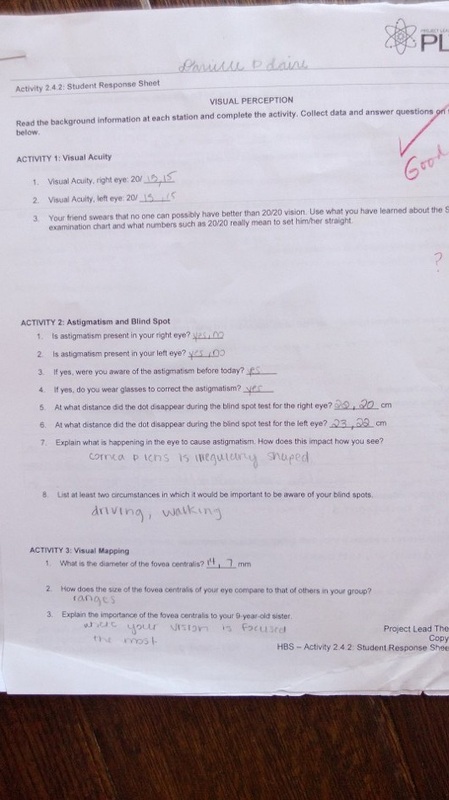
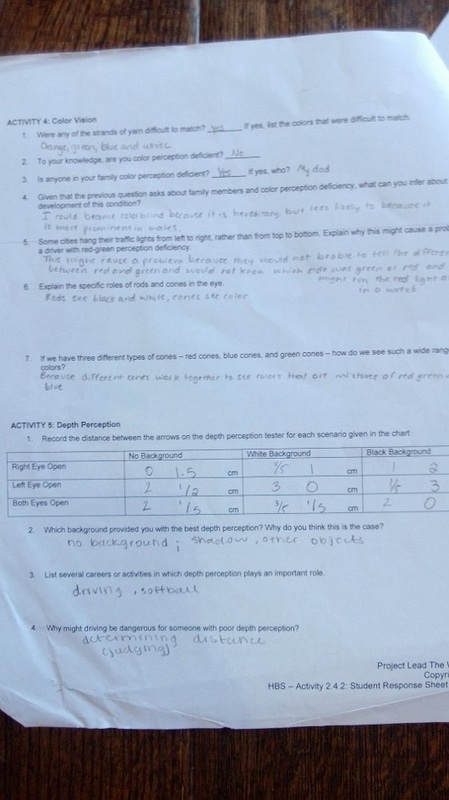
Activity 2.4.2: Visual Perception Lab- Using the eyes and understanding perception.
